Creating reports
Within the Reporting Panel, you’ll find:
- Dozens of pre-built (default) reports, grouped under ‘libraries’ such as Agenda, Functions, Accommodation, etc. These are all based on the common needs of event managers (for example, under Presentations, there’s a pre-built report for speaker A/V requirements).
- Filters to allow you to include and/or exclude certain data. You can also create what’s called a Data Snapshot (read more about this in a later section).
- A ‘copy’ button so you can create your own edited version of a report.
- The editor where you can add, remove, or combine data fields to include; there are also styling options to change fonts and colors, add a logo or watermark image etc.
You can also:
Publish reports online as Quick Reports. These are also accessible from the Organizer App and Client Info Portal.
- Use the Preview Viewer button to see your report, and export data into an Excel spreadsheet, a PDF document, a CSV file, or other popular file formats. The report will open in a window within EventsAir.
- Use the Preview PDF button to generate a downloadable PDF while you perform other tasks. This is really useful if you’re generating a number of reports. The name of the report appears at the top of the screen with a progress indicator, and a green tick when complete and ready to view.
Reports can also be generated from:
- The Communications panel. You can create a Merge Doc with an “Attached Personalized Document” component. This allows you to send a mailout to all your attendees that will attach each person’s unique personalized version of a report (such as the Itinerary or Registration Packet).
- The Attendee panel. You can do something similar for just one person, using the Print Personalized Document tool, (over to the right when you’re looking at a person’s contact record). This will generate an attendee’s unique version of a report as a PDF, which you can attach to an email.
Note: For either of the above, only reports that are relevant to individuals can be generated. Event-wide reports designed for event managers aren’t included in these tools.
There are other ways to generate reports, not covered in this article:
- Express Action reports (Standard and Comprehensive Exports) - often the quickest and easiest way to get exactly the combination of data you want.
- Global reports – broad statistics from all your events, available from your overall Application Setup.
Types of reports in the Report Panel
There are more than 150 default pre-defined reports available under various libraries. These can all be sorted, filtered, and customized as needed.
TIP: Depending on the data in your event, the full report library may take a few seconds to appear when you first open the Reporting Panel.
A general outline of what’s available in each report library is listed below:
- Contact library. These are reports that relate mainly to contact information such as labels and country/state of origin statistics, check-ins and change log reports, dietary requirements, communication logs. There are also reports you can send to attendees as personalized attachments to a merge doc, such as Itinerary, Certificate of Attendance, and Registration Packet.
NOTE: The Attendee Information Sheet is a report to which you can add information from other modules. However, consider whether you need to do this or would be better off using a Standard or Comprehensive Export instead.
- The Notes and Marketing report libraries only have one default report each, relating to Notes and Marketing tags respectively.
- The Registrations report library includes many different default reports on registration types and statistics, and various appointment and meeting lists.
- The Agenda report library contains default reports on Agendas and sessions.
- The Functions report library includes many default reports about function attendees, hosts, guests, fees, times, tables, and more. There are also a number of specific reports for golfing events.
- The Accommodation report library includes hotel arrival and departure lists, group inventory, reports on hotel rooms and sub-blocks, hotel transfer details and more.
- The Travel report library has default reports on flight arrivals, departures, airlines, flight numbers and more.
- The Presentations report library includes default reports about abstract review status, speakers’ requirements, session details, sessions, registrations, and more.
- The Exhibition report library includes lists of exhibitor stands, name badge details, signage, extra charges, and more, as well as meeting schedules, preferences, and details (for exhibitors).
- The Sponsorship report library has default reports on sponsorship inclusions, contacts, and packages.
- The Financial report library covers many crucial reports on payments, refunds, outstanding balances, invoices and receipts issued and more. Invoices and receipts themselves can also be generated from here as reports.
NOTE: The Event Statistics Report, under the Financial library, is one worth knowing about. It can be filtered instantly to provide a wide scope of statistical details and information. It gives a succinct summary of attendee registrations, function sign-ups, accommodation details and much more.
- The Accounting report library lists transactions, accounts, expenses summaries, and simple profit/loss statements and balance sheets.
- Finally, the EventStream report library lists EventStream Engage QR Codes.
How to generate a report
To generate a basic default report, first select from the Report Library a particular data collection. You’ll see the Report Library as a list on the left (Contact or one of the other modules).
IMPORTANT: Reports from specific module - such as those in Functions - can’t include fields from another module (e.g. Accommodation).
If you want data from more than module, you can either:
- Choose a more general report from the Contact default reports, and add fields to it
OR
- Use the Express Actions panel to create a Standard Export or Comprehensive Export (see separate article on these options).
Next, choose a report from the list under that module.
If needed, refine your report using the Filter icon – you can filter a report on any field contained in the selected module.
Before looking at how you can copy, edit, and view/download/share your report, you may want to find out more about filtering, Selected Records, and Data Snapshots.
Filtering report data
For each report you run, you can add extra filters to refine the results, based on selected fields. It’s fine to run your report without any filters, but just to be sure, you’ll always be asked to confirm this:

Report filters operate in much the same way as Attendee Search filters. Start by clicking the filter (funnel) icon in the “Set Filter” area above where reports are listed:

Let’s say you want to see a report on all attendees who are attending a particular function AND who are staying at a certain hotel. You would:
- Select the Functions report library from the left-hand panel
- Select a report (for example, Functions List by Attendee)
- Select the Filter icon (next to Target Group, under Set Filter)
- Within the filtering section, choose the Functions module and select the function(s) you want this report to show data for.

Be sure to select “Apply” each time to apply a filter. (You can also do this after you’ve chosen all your filters).
Note that you can INCLUDE a group in the report data, and the “no” or “prohibited” symbol (circle with backslash) is not enabled (gray).
Select the “no” symbol and it will turn red, and this will EXCLUDE the group you’re filtering on.
- Finally, because in our example you want to know how many people attending that function are staying at a particular hotel, you would select the Accommodation module under Filter, and nominate which hotel (or hotels) you want included in the data set.

More report filtering options – using ‘to’ and ‘from’ ranges
You could narrow down your list even further to find people who are going to that function, staying at those hotels, and whose last names begin with either D, E, F, or G.
You can do this by setting a “to” and “from” range under the Contact filter module, using “D” and “G” as your “to” and “from” values. This alphabetical range option is only available for some fields, such as last name and organization. You can also set date ranges for many fields, or amounts (in financial-related filters).

You can see by the dots next to each module name (Contact, Functions, and Accommodation) where filters have been applied.
You can also now see the relevant icons next to the Filter icon:

When you run your report, it will filter the data accordingly.
You can come back and clear some or all filters later (using the “Clear” button).
You can also save your filtered report as a Quick Report (for example, naming it “Gala Dinner and Hotel X and Y, D-F) and the filters will again be applied next time you run it. See more on Quick Reports later in this article.
Saving a filter
You can name and save a filter, using the “Save” button within the filtering panel.
A saved filter can be applied later (for example, to another report or an export from Express Actions) using the “Load” button, which will bring up a list of saved filters.

Data Validation filters
Use this to validate data – find people who have (or haven’t) got information in that specific field.
Choose from many default options to see only those people who have (or haven’t) supplied an email address or photo; booked accommodation; etc.
These options also cover specific attendee types such as exhibitors and presenters, making it easy to filter reports based on, say, which presenters haven’t yet booked their travel.
For more information on searching and filtering within contact records, see the related article on this topic under Attendee Management.
Selected Records tab
Under the Selected Records tab, you can see all the contacts currently included in that report. You can choose to exclude particular records by manually deselecting them.

Data Snapshots
Under the Selected Records tab, you'll see the option to Save as Data Snapshot.
A Data Snapshot captures, or “remembers” the results of a search or report filter (at that time) so you can re-use that particular data set later.
(If you want to save the filter itself, to search on it again later and get updated results, use the save button in the filter function.)
Because a Data Snapshot only captures data for a specific moment in time, you also need need to set a time limit for it to be kept. You set this timeframe (from 1 to 14 days) when you create the snapshot.
You could use a Data Snapshot to (for example):
- Compare the number of registrations received a week ago to yesterday’s registrations.
- See a list of anyone with dietary restrictions who’ll be attending the gala dinner, but only if they registered since last Monday (you'd do this by filtering OUT the data set of people who registered before Monday, using your saved Data Snapshot).
- Pull up the results of a previous search (e.g. how many VIPs went on the city tour), and add an extra filter (how many of them played golf the next day).
While you could probably add these search criteria within a single search, a Data Snapshot can save you time.
Creating a Data Snapshot
1. Select your report, add filters if needed, then click on the Selected Records tab.
2. This shows all active records who meet your report criteria (including any filters) at that specific moment.
3. To save this data as a Data Snapshot, select Create Data Snapshot.
4. The window below will appear:

2. Enter a name and a number of days for which the snapshot will be available.
3. When running any other report, you can now filter to include (or exclude) the data set contained within that Data Snapshot.

Appending and Replacing Data Snapshots
In the Data Snapshot creation pop-up, you can create a new data snapshot, but you can also:
- APPEND (add more contacts) – adjust the filters or selected records, and “append” (add) the extra contact records to your Data Snapshot.
- REPLACE – (replace or update the original list) – adjust the filters and/or selected records, and then replace the original data with the revised list of contact records.
When a report is selected – buttons available

"Add Custom" button
EventsAir can create custom reports for clients as an additional service (talk to your account manager for more information). If you’ve purchased a custom report, when you select the Add Custom button you’ll see a list of available custom reports. (If you haven’t purchased any Custom Reports, nothing will appear when you select this button.)
Custom Reports are also available in Global Reporting – see separate article.
- Create Quick Report – select this to create a web-enabled report so you can readily (and rapidly) distribute it via a link to clients, suppliers, staff, etc., or make it accessible from the Organizer App. See more detailed section below.
- Copy - creates a copy of your selected report, and adds it to the displayed list of reports, with "Copy" showing in parentheses. You can then rename and edit it (adding new filters, design elements etc.)
- Edit - access the Report Designer/Report Editor, where you can modify columns, fields and other report functions.
- Delete - deletes the selected report. Note: You can’t delete default reports – only copies / reports you’ve created.
- Preview Viewer - see the report on your screen, search within it, and/or print or download/export it to various formats.
- Preview PDF – create a downloadable PDF.
All about Quick Reports
Quick reports allow you to easily share, via a link, a pre-filtered report that updates data each time it’s accessed. You can share this securely with vendors, clients and other authorized parties via an email sign-in.

- When you create your own Quick Reports, you’ll see them in their own report library, right at the top of the Report Library list.
- Quick Reports can also accessed from both the Organizer App and the Client Info Portal. (You can read about these in separate articles.)
Examples of Quick Reports:
- A hotel check-in report filtered for just one specific hotel, visible only to you and your team, and the staff at the specified hotel.
- A function list report filtered for one specific optional tour, available to your staff and the tour vendor for up-to-date access at any time.
To create a Quick Report:
- Select the Report Library (from the list on the left).
- Select a pre-defined report.
- Apply filters (if needed).
- Select the Create Quick Report button (bottom the page). You’ll see a pop-up:
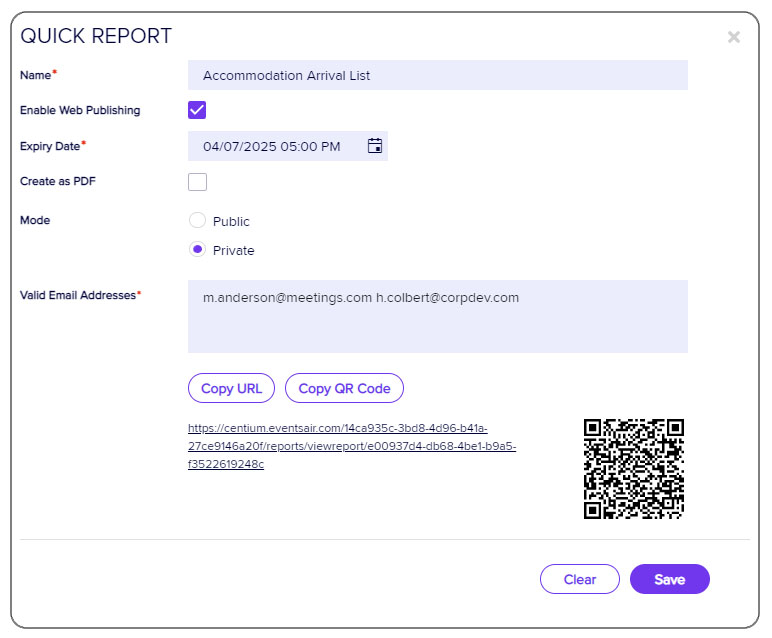
- Enter a unique Name for this report.
- To create a web-accessible link or QR code, select Enable Web Publishing.
- The pop-up expands, and creates a default expiry date (which you can change).
- In almost all cases, you should set the report mode to Private (recommended – see information below).
- Enter the email addresses of authorized third parties who can access this report.
- Save the QR code / URL to send to those who need access (unless they’re using the Client Info Portal or Organizer App).
If you’d prefer people to see the report as a PDF when it’s opened in a browser, select Create as PDF. [If you don’t check this, recipients can see the report in a browser window and choose to download it in various formats.]
IMPORTANT – why Quick Reports should be published as private
Data Processing, Privacy and Data Protection:
Whether a vendor, catering company, or external contractor, anyone who has access to personal data is a third-party processor under privacy regulations.
Because many Quick Reports contain personal data (a name or photo right through to personal information such as dietary preferences), you should be very security conscious when handling these reports.
By creating the report as Private, only nominated parties can receive a report or export via email. This process lets the EventsAir Data Protection Toolkit track and log authorized third party access to a Private Quick Report or Export.
Copying a report
- Select a report
- Click the ‘copy report’ button (you will need to set the access / report properties – see below)
- It will appear in the list of reports as “[Name of report] (Copy x)” – each time you copy a report, a new number will appear instead of x
- Double-click the report you just copied, so you can enter a new name for it
- You can now edit the new report
Managing properties (access) for a copied report
When you copy a report, you’ll be asked to set “properties”, i.e. where it can be accessed from (either just in this event, or in all your events).

You can allow access to this report from:
- This event only – the report can only be accessed within the current event
- Events for – if you’ve enabled multi-office as part of your EventsAir installation, this option will display a drop-down list of available offices. You can choose multiple offices from which to see and run this report (search for Offices for more information on multi-office options).
- All events - your copied report will be visible to all events in your installation of EventsAir. This is the default selection for Report Properties.
NOTE: If you have a report visible to all your events, and you make changes to it, this will change it in all events. For this reason, you may want to create a ‘template’ version and copy and edit it for each event if you need to.
You can return to the Report Properties window later by clicking on the Report Property Button ![]() to the right of each copied report. If you change a report from “accessed by all events” to “accessed by this event only”, it will not appear in other events any more.
to the right of each copied report. If you change a report from “accessed by all events” to “accessed by this event only”, it will not appear in other events any more.
Editing Reports
You can usually find a predefined report in EventsAir to meet your needs. You can also apply filters to refine your reports. But sometimes you may want to display data differently.
For example, you may like the design and format of the Contacts Name and Address List Report shown below, but want to change Position to Email Address:

You can edit the report like this:
- Highlight the default pre-defined report, Contacts Name & Address List.
- Select the Copy button, and click Save in the pop-up.
Now you can see the copied report in the list: Contacts Name & Address List (Copy). - Double-click on the name and rename it as you wish.
- With the report still highlighted, click the Edit button, and the Report Designer will open so you can make changes.
The Report Designer [also called the Report Editor] is easier to use than it may look at first.
It’s a powerful system so there are many different options, but editing is easy when you know how.

If you want to edit headings and fields, the first step is to look for the Headings of your report columns in bold: in this case, ID, Name, Position, etc.
Below that, in square brackets, [ ], you can see the field names. This is where the data is being pulled from to create the report. For example, under the heading Position, you can see the field name [Position]. To create your report, information is pulled from this field for each attendee record you've asked for.

To change the title and the information appearing in this column, follow these steps:
- Double-click on the word Position in the column header section.
- Edit the text to read Email.
You’ve changed the title; now change the field underneath (so it will pull the correct data).
- Click on the [Position] field in the details section, and then select Cut (the scissors icon at the top) to remove it.
- On the right, select the Fields icon (it looks like a cylinder or stack of discs) and expand DataSource to show the list of Data Fields you can choose from.
- Search for Primary Email.

To position your new data field and adjust the columns:
- Click on Primary Email, and keep your left mouse button held down as you drag it across into your report. It should sit where the [Position] field was before – in the Detail band, and under your new “Email” heading.
- Adjust the width your other headings and fields as needed, dragging the edges of each box to adjust them.
- Click save (the floppy disk icon on the top) to save your newly edited report and exit out of the report.
You can now run this report and it will look something like this:

More about editing Reports:
- You can follow this same process to add or remove other column headings (and their matching Fields/data sources) as needed.
- You can also apply many of the same principles to editing name badges.
- See the section below on image editing, and for more information on editing reports including adjusting images, how to flip or rotate text and more, please search our FAQs.
- You may also want to search for more detailed information like how to add custom fields and use logical functions/expressions in your reports (for example, how to make each registration type a different color on badges).
Adding images to reports
You can add an image to a report (or name badge) within the Report Editor, by dragging the image icon into the Report Designer from left-hand panel of tools.

You may need to first make room for your image by dragging outlines or borders to adjust the height or width of other elements in the report.

While the image box is selected, you can choose from the right-hand panel under Properties either:
- an Image Source (click the three dots here to open your file explorer and choose an image from your local drive);
OR
- an image URL (e.g. copy and paste the link for an image you’ve stored online, such as in your AirDrive).

You can also set other properties such as transparency here.
Adding a watermark image/background
Look for the Report Properties icon on the right-hand panel. It looks like a computer branching down into two documents.

In the Report Properties panel, hover over “Report” and then select the editing icon (pencil).

Under Appearance, look for Watermark and expand it.

Select an image source, and the appropriate image transparency (0 is no transparency, so if you want a true ‘watermark’ (semi-transparent), increase this. Leave it as 0 if you want a certificate-style full background.
Still in the Watermark section, check that the “Show Behind” box is enabled (which will send your watermark image to the back and allow any other fields you had to appear in front of the watermark).
Change image size and alignment as needed.
To see the watermark in the Report Editor, expand the Design element and tick the “Draw Watermark” box. (This is only if you want to see how it looks without going into a report preview.)

Image sizing mode in reports
When you place an image into a report, it will appear differently, depending on how you set the XRPictureBox.Sizing properties and the size of your “control” / container [box where the image is being placed]. See below for more information.
When Image Size Mode is set to Normal:

Image displays as per its original dimensions. (In this case, in the top left. To display the image in the middle of the control/container, set the sizing property to “normal” and alignment to Middle Center.)
When Image Size Mode is set to Stretch:

Image is stretched to fill the width and height of the container (and if ratio of width to height isn’t the same, may appear distorted/stretched). You wouldn't do this with a normal image but perhaps you could for a texture or gradient.
When Image Size Mode is set to AutoSize:

The container’s dimensions are auto-adjusted to match the size of the image.
When Image Size Mode is set to ZoomImage:

Image will be resized (in proportion) to best fit the container. There may be gaps.
When Image Size Mode is set to Squeeze:
This setting will auto center and resize your image to fit the maximum space available, but still keep the correct aspect ratio. However, if the frame is bigger than the image's dimensions, the image will only resize to its maximum (there may be a gap around the edge).
 OR
OR 
When Image Size Mode is set to Tile:

The original image is replicated within the picture control [box] starting from the upper-left corner. The replicated image is clipped if it does not fit in the picture control which contains it.
When Image Size Mode is set to Cover:
 The original image is centered, and sized proportionally to best fit the picture box area. This will be a simple resizing if the height:width ratio of the image and the box match. Otherwise, the least matching of these (height or width) is sized to the control box, and the other cropped to fit (i.e. some clipping of the image will occur).
Viewing your report
Set your Report Options
Before viewing your report, you can fine-tune how it will look, using the “Report Options” on the far right-hand side. (Leave these blank to use the default settings.)

Report Subheading – add some extra text under the report heading if needed.
Order By - Choose either from the default sort orders for that report, or create a custom sort order (available fields will vary by module). You can add extra sorting levels. For example, the above is sorted by Contact ID, then by Date.
Other options (if visible) - Some reports will let you turn on/off different levels of information found within the report. For example, some reports in Accommodation allow you to tick an “Include Cancelations” box (which only appears if applicable).
Report Preview Viewer / Preview PDF
To see your report, you can either choose “Preview Viewer” or “Preview PDF”.
If you choose Preview Viewer, your reports will run and open directly in EventsAir.
Preview Viewer window: When looking at your report in a window (Preview Viewer), you can use the tools below to search for, or jump to, a particular page; toggle between multiple and single page view; print, download/ export, search, and view full-screen.

- If you choose Preview PDF, each report appears at the top of the Reporting Panel, displaying an indicator while the report is processing. When complete, the indicator becomes a tick, and the name will become a clickable link to a PDF. You can set this up to run multiple reports in the background and come back later to see them.
This article covers reports available within the Reporting Panel.
You can also read separate articles about:
- Generating ‘reports’ (spreadsheets) from the Express Actions panel (Standard or Comprehensive Exports – these can be saved as Quick Exports, which work much the same way as Quick Reports)
- Global Reporting (reporting across all your events)